The Occupancy Report provides a detailed historical report of daily occupancy during a specific date range.
This report is typically used to analyze past Occupancy, ADR, REVPAR by Room.
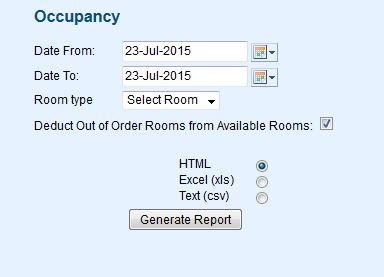
To run an Occupancy Report, follow these steps:
- Date From: Choose a Date Range. This can be one date as shown in the example or a range.
- Room Type: Choose a specific Room Type or just leave on "Select Room" to see all room types.
- Deduct Out of Order Rooms from Available Rooms: Check this box if you DO NOT want to include OOO rooms in the Occupancy Report calculations.
The Report contains the following fields:
- Date: When run in a single or multi day query, each date will be broken down into a unique line.
- Occup %: Occupancy Percentage is calculated by dividing the number of occupied rooms by the total number of rooms.
- Booked: The number of Rooms occupied on that day.
- ADR: Average Daily Rate is calculated by dividing the total Room Revenue by the number of occupied rooms for the date returned.
- REVPAR: There are two industry standards for calculating REVPAR. 1) Total Room Revenue for the date range divided by total number of available rooms for the same date range. 2) Average Daily Rate multiplied by Occupancy %. We utilize method two in all reports and reach your REVPAR by (ADR * OCC%).
See a Sample Occupancy Report.
Key Differences between the Occupancy and Occupancy Forecast Reports
- The Occupancy Report is based on past reservations, while the Occupancy Forecast is based on future reservations.
- The Occupancy report requires a room assignment, while the Occupancy Forecast does not;because a room may not have been assigned yet.
- The Occupancy Report gives the option of deducting "OOO" Rooms from the Rooms Available total. The Occupancy Forecast report always deducts "OOO" Rooms from the Rooms Available total. For Example, if you have 50 Rooms available and 2 are OOO, The Occupancy Forecast will show 48 total rooms available.
- The other key difference is when you run the Occupancy Forecast Report, you can choose to include or exclude Group Booking allocations. This setting changes the total # of rooms. See a detailed description below.
- In summary, the reports are pulling two different data sets that will provide different results.
Overview
Content Tools