The Front Desk Dashboard displays a "Daily Snapshot" of Occupancy data and a graph displaying Occupancy by Room Type.
All of the individual bookings displayed in the Occupancy data section can be see in Reports, In House and Search Bookings.
For example, if you see 62% Occupancy and 11 Occupied Rooms, then go to REPORTS and run a Occupancy Report or an In-House Report. To see the individual bookings, go to the In House List or look at the Tape Chart.
Front Desk Dashboard
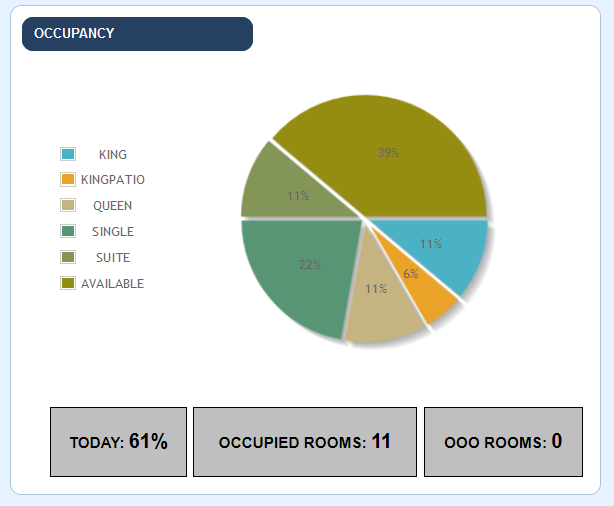
Occupancy Graph: Displays the occupancy percentage for each Room Type for "Today's Date".
Today: Displays the current Occupancy by percentage for "Today's Date"
Occupied Rooms: Displays the total number of Rooms to be occupied on "Today's Date". If there is a booking that has yet to be assigned to a Room, that will not show in this calculation.
OOO (Out of Order) Rooms: Displays number of rooms currently out of Order.
Overview
Content Tools