Page History
| Section | ||||||||||||||||||||||||||
|---|---|---|---|---|---|---|---|---|---|---|---|---|---|---|---|---|---|---|---|---|---|---|---|---|---|---|
|
| Section |
|---|
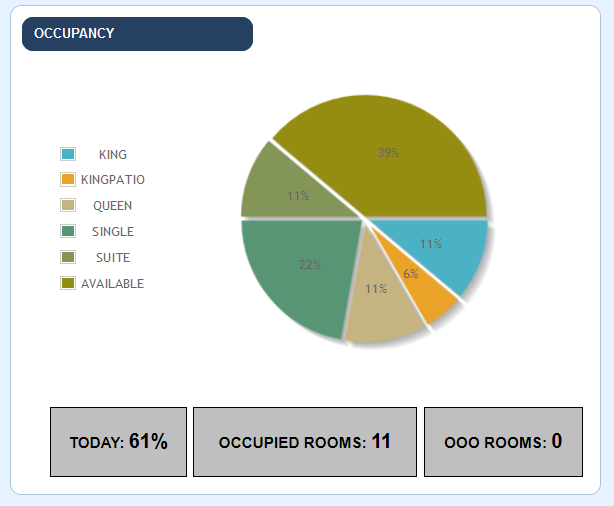
Occupancy Graph: Displays the occupancy percentage for each Room Type for "Today's Date". Today: Displays the current Occupancy by percentage for "Today's Date" Occupied Rooms: Displays the total number of Rooms to be occupied on "Today's Date". If there is a booking that has yet to be assigned to a Room, that will not show in this calculation. OOO (Out of Order) Rooms: Displays number of rooms currently out of Order.
 |
Overview
Content Tools