Incoming requests and ongoing analytics
Every single request is captured in your MyGuest system
displayed in an easy-to-follow online dashboard. Your staff will never miss a beat – all open/active requests are fully visible and staff can be alerted to new entries via ‘push’ notifications. Up-to-the-minute charts and graphs display activity in visual format.
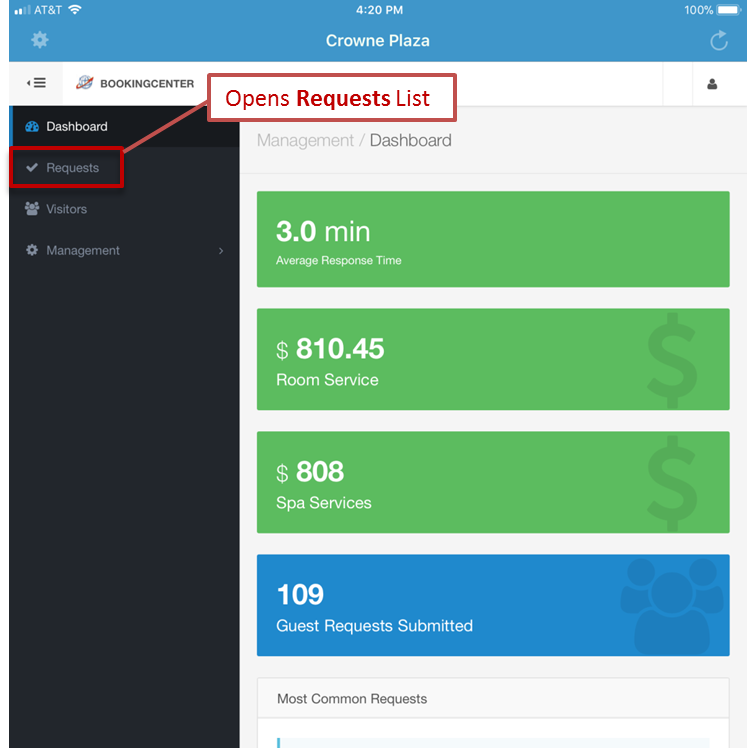
This is the Requests Screen. All requests are listed here. You are now ready to receive requests.
MyGuest
Requests Screen
This is the Requests Screen. All requests are listed here.
newrequest for YOUR department will show a Notification like this:
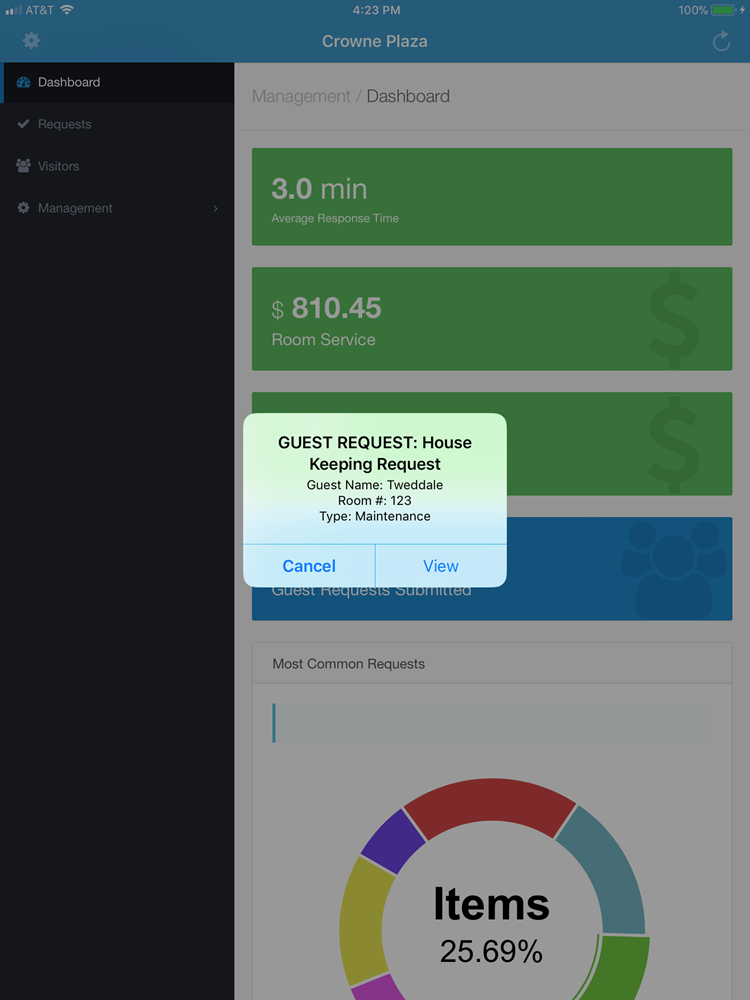
Press the View button to see the Request Details screen. OR, press the Cancel button to return to the
Requests Screen. You can press on any requests to see the Request Details screen.
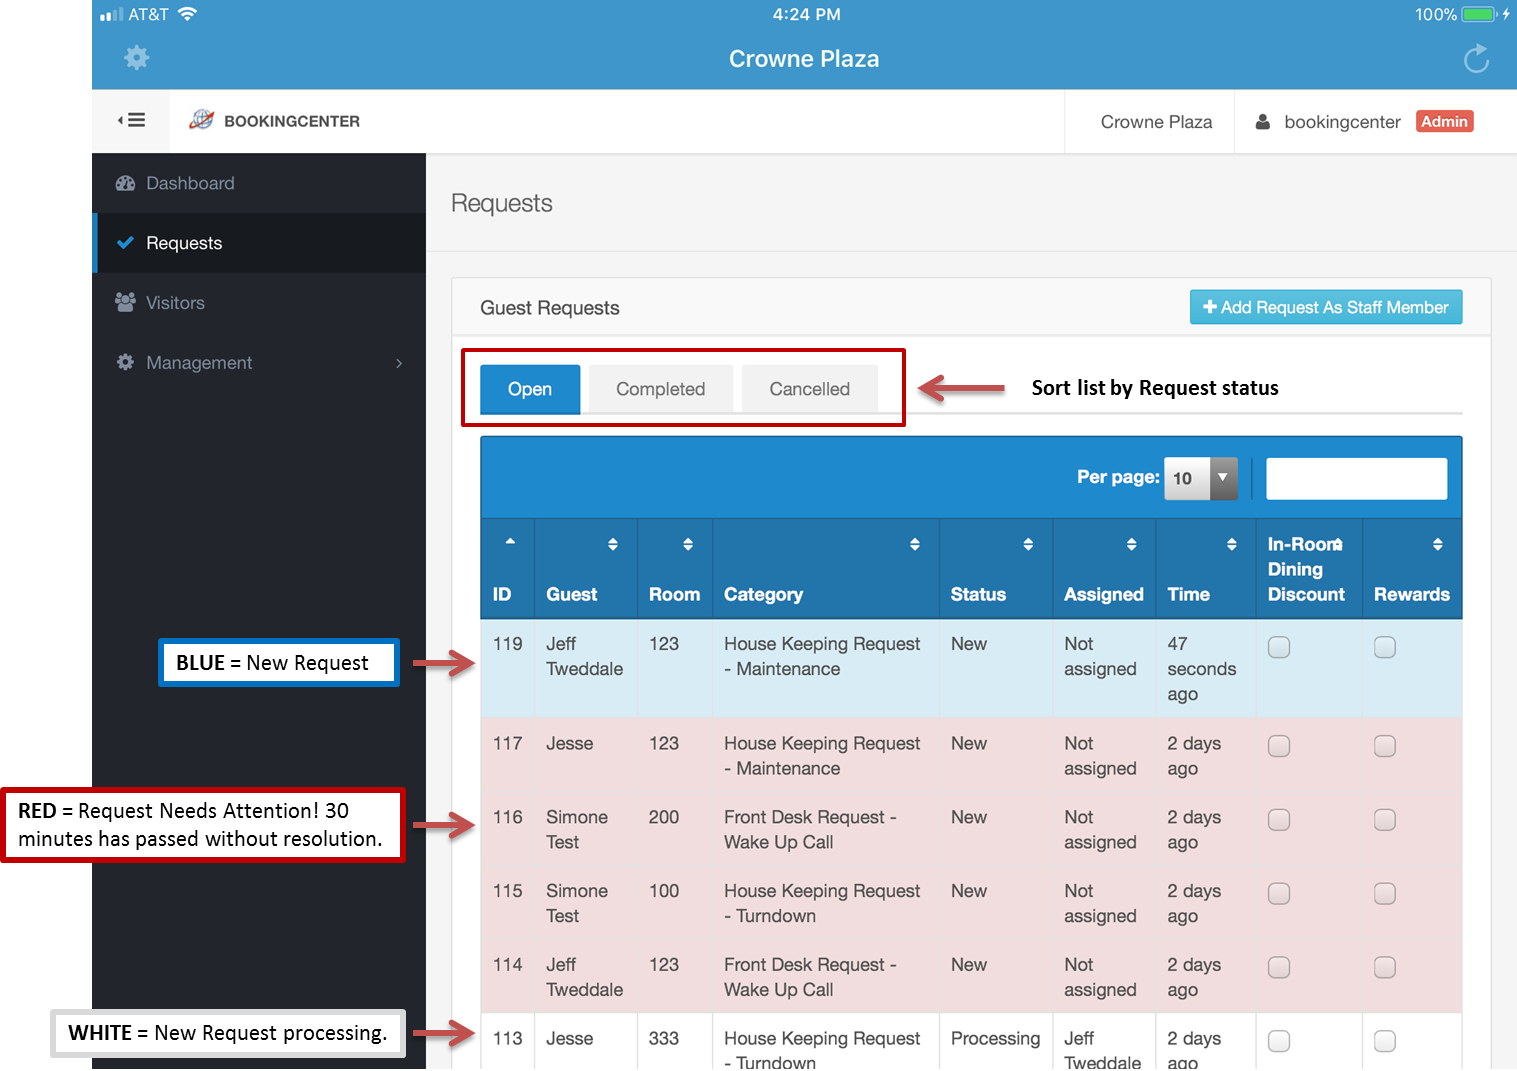
A. Colors for OPEN requests:
- BLUE COLOR = this is a new request
- WHITE COLOR = this request is being processed
- RED COLOR = 30 minutes has passed and this request needs attention
Overview
Content Tools