| Section |
|---|
| Column |
|---|
The Front Desk Dashboard displays a |
|
...
All of the data displayed on the Dashboard is same as as the located in Reports, on the Tape Chart, etc. and can be looked at in further detail in any of these areas.
section displaying the total number of "BOOKINGS MADE TODAY" by Source on the graph.This includes all bookings made at the Front Desk, Website and Online Channels. The total number of bookings that have been made at the frontdesk or online on "Today's Date" is displayed next to "BOOKINGS MADE TODAY". The number of bookings that have been created by each source are displayed in the graph. The Bookings displayed on the Dashboard can also be located and looked at in further detail here: |
|
...
...
- On Start Date" and "Created On End Date"
|
|
...
| | Panel |
|---|
| borderColor | #559ADE |
|---|
| bgColor | #F0F0F0 |
|---|
| titleColor | #ffffff |
|---|
| titleBGColor | #559ADE |
|---|
| borderWidth | 1 |
|---|
| title | Front Desk Dashboard |
|---|
| |
|
|
Example
BOOKINGS MADE TODAY: 5 .
The graph displays 2 Referral, 1 Expedia, 1 Booking.com and 1 Website.
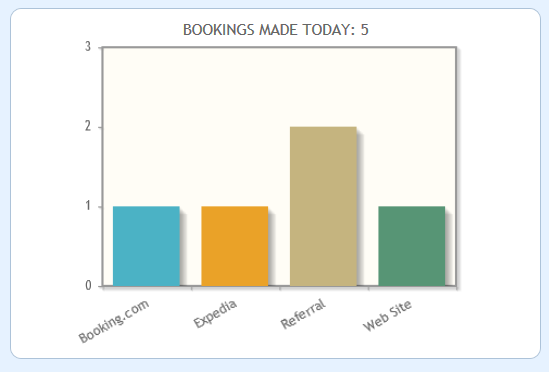 Image Added