Page History
| Section | ||||||||||||||||||||||||||
|---|---|---|---|---|---|---|---|---|---|---|---|---|---|---|---|---|---|---|---|---|---|---|---|---|---|---|
|
| Section | ||||||
|---|---|---|---|---|---|---|
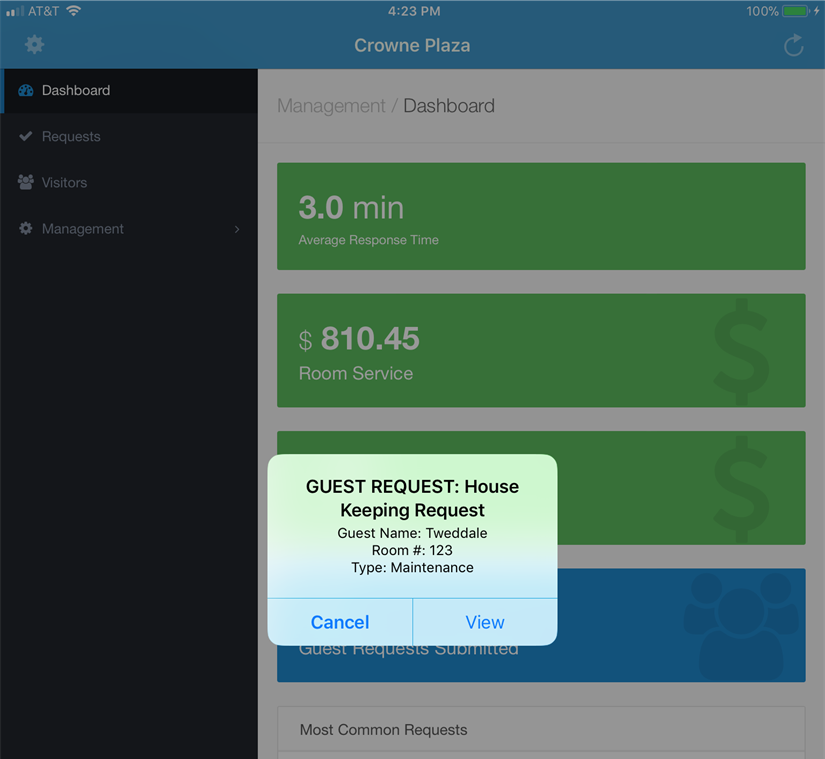
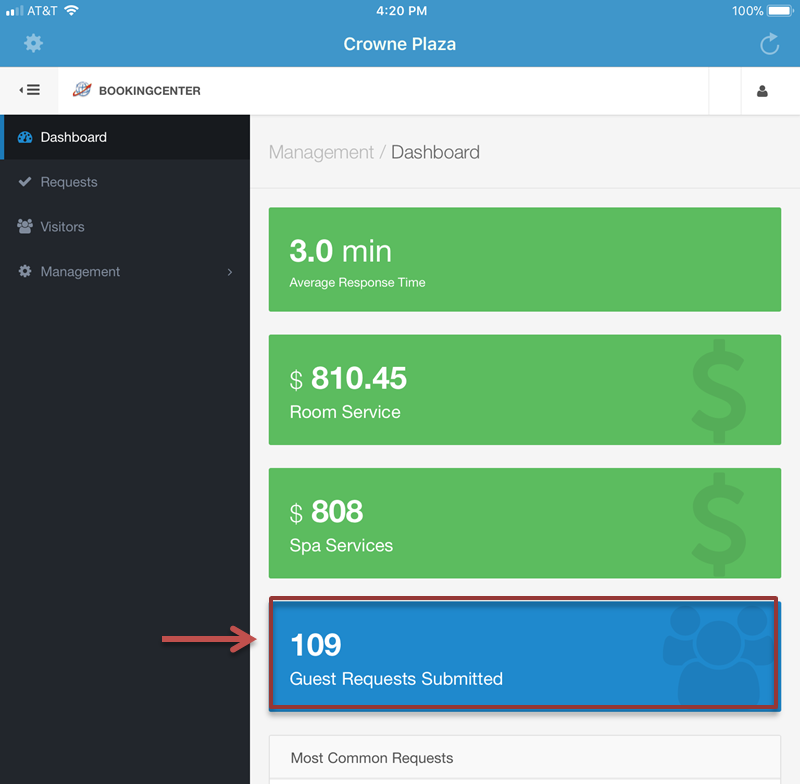
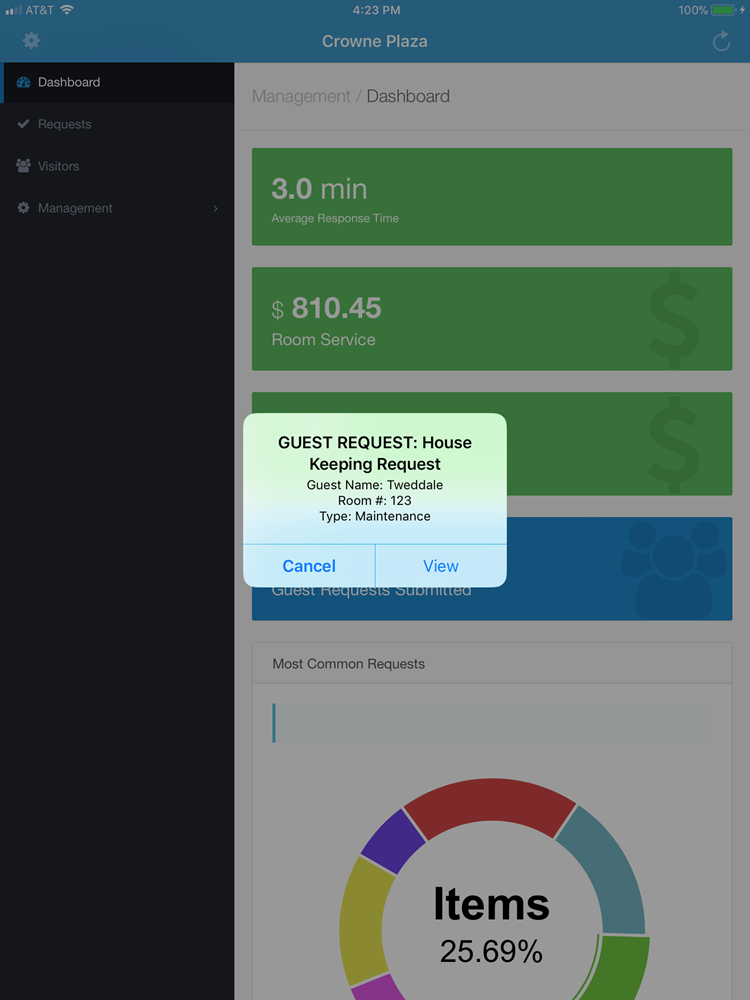
Incoming Guest Requests When a new Guest Request is captured in your MyGuest system, an automatic notification is displayed on the Dashboard. The Request will also be added to the total number of "Guest Requests Submitted" on the DashboarDashboard. .
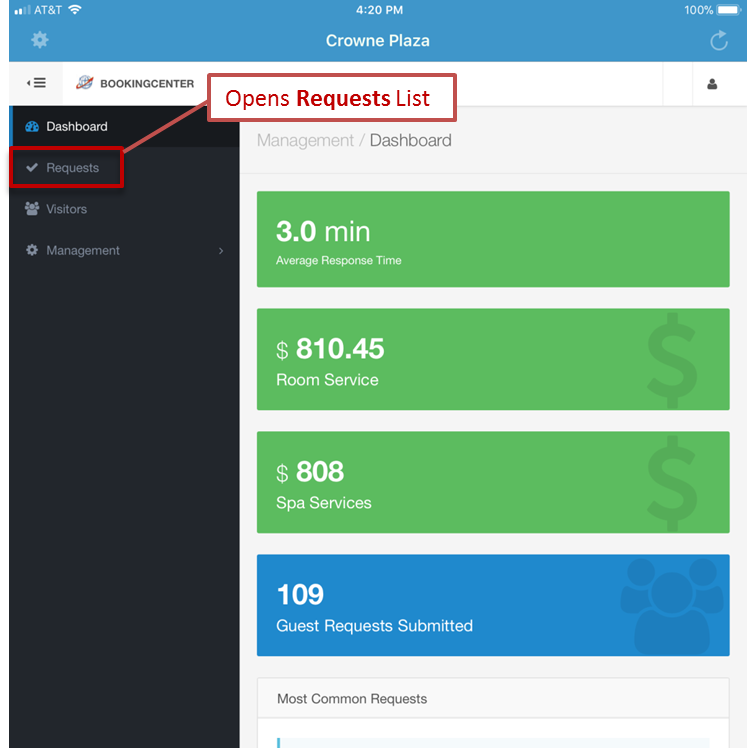
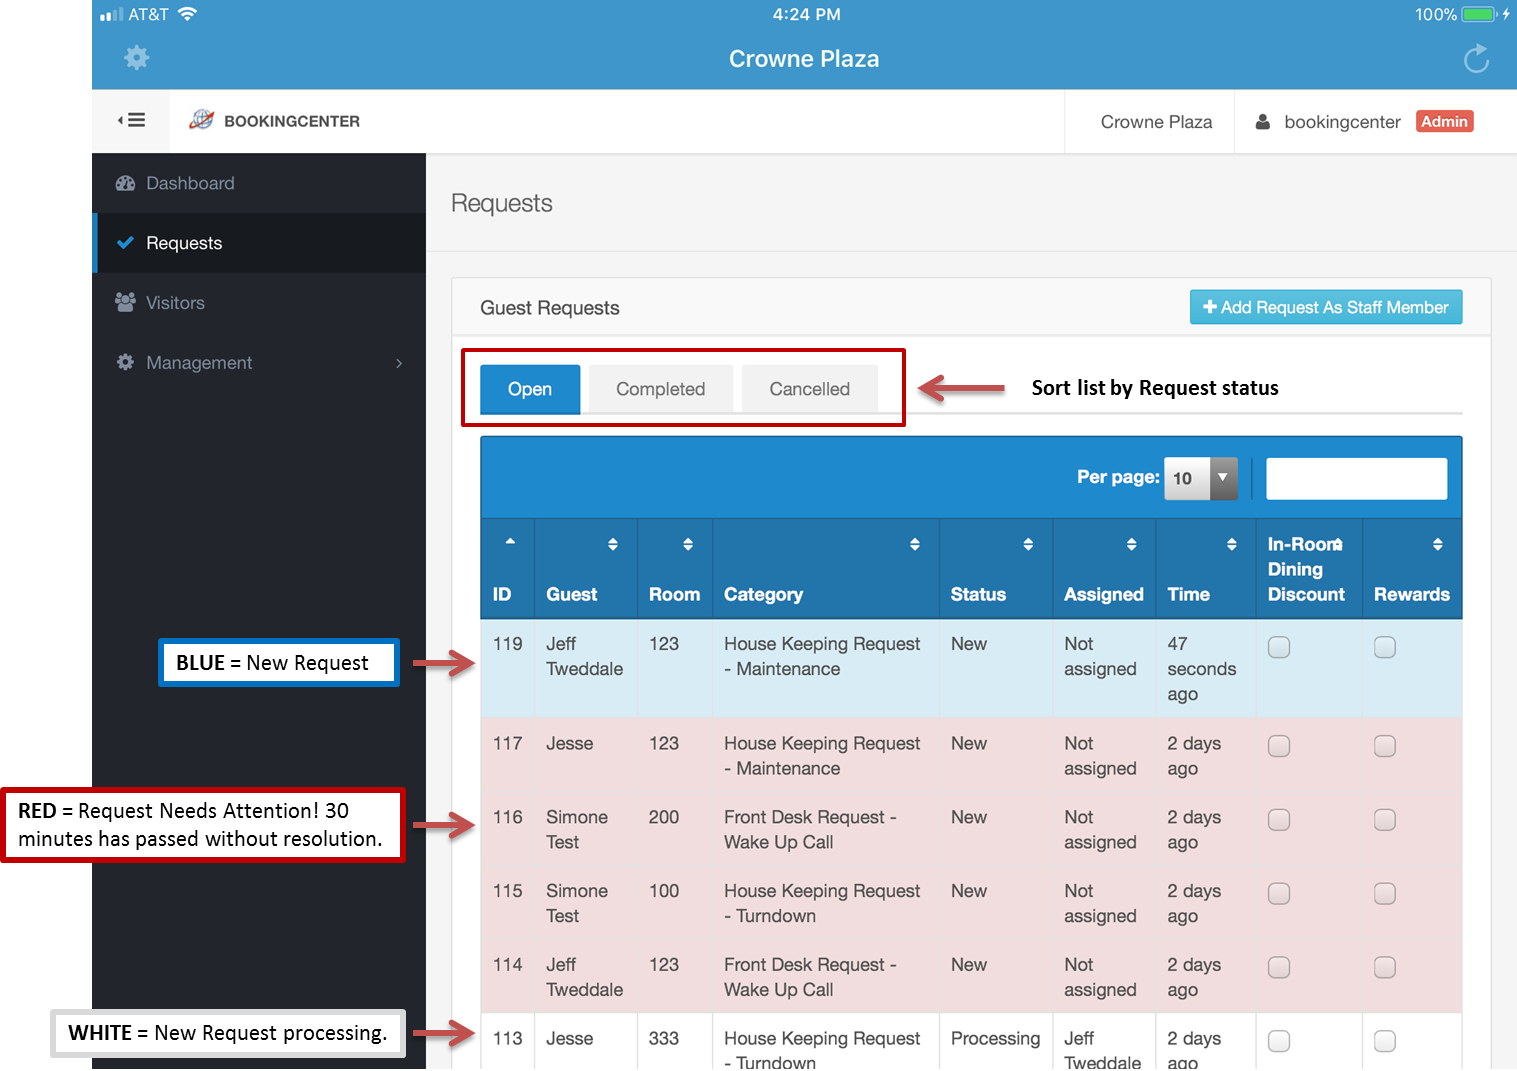
Viewing Guest Requests To view a list of all Guest Requests , click on Requests in the left menu. From here, you can click on the Dashboard. This is the Requests Screen. All requests are listed here.
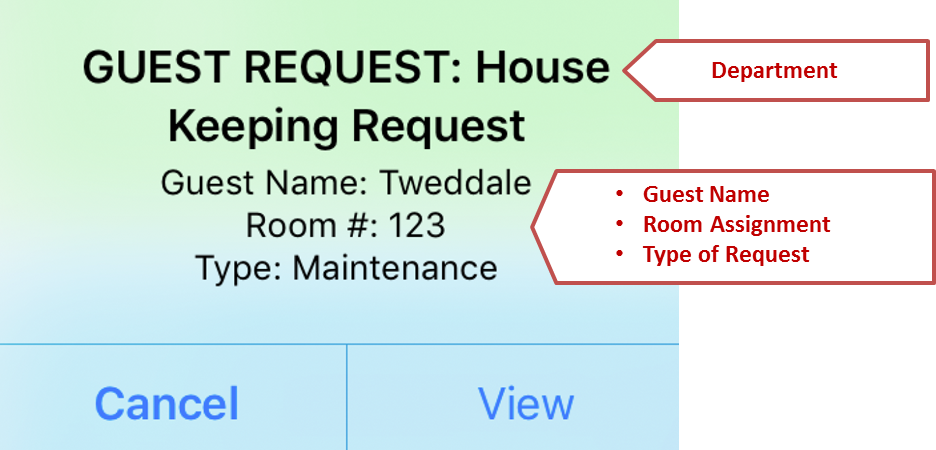
newrequest for YOUR department will show a Notification like this: each Guest Request to see the details, status and add comments.
Press the View button to see the Request Details screen. OR, press the Cancel button to return to the Requests Screen. You can press on any requests to see the Request Details screen.
A. Colors for OPEN requests:
|
| Section | |||||||||||||||
|---|---|---|---|---|---|---|---|---|---|---|---|---|---|---|---|
|
Overview
Content Tools